Stop Guessing. Start Closing.
AI-powered roofing market intelligence that tells you exactly where to knock, when to go, and how much you'll make.
Get StartedFind the Right Doors
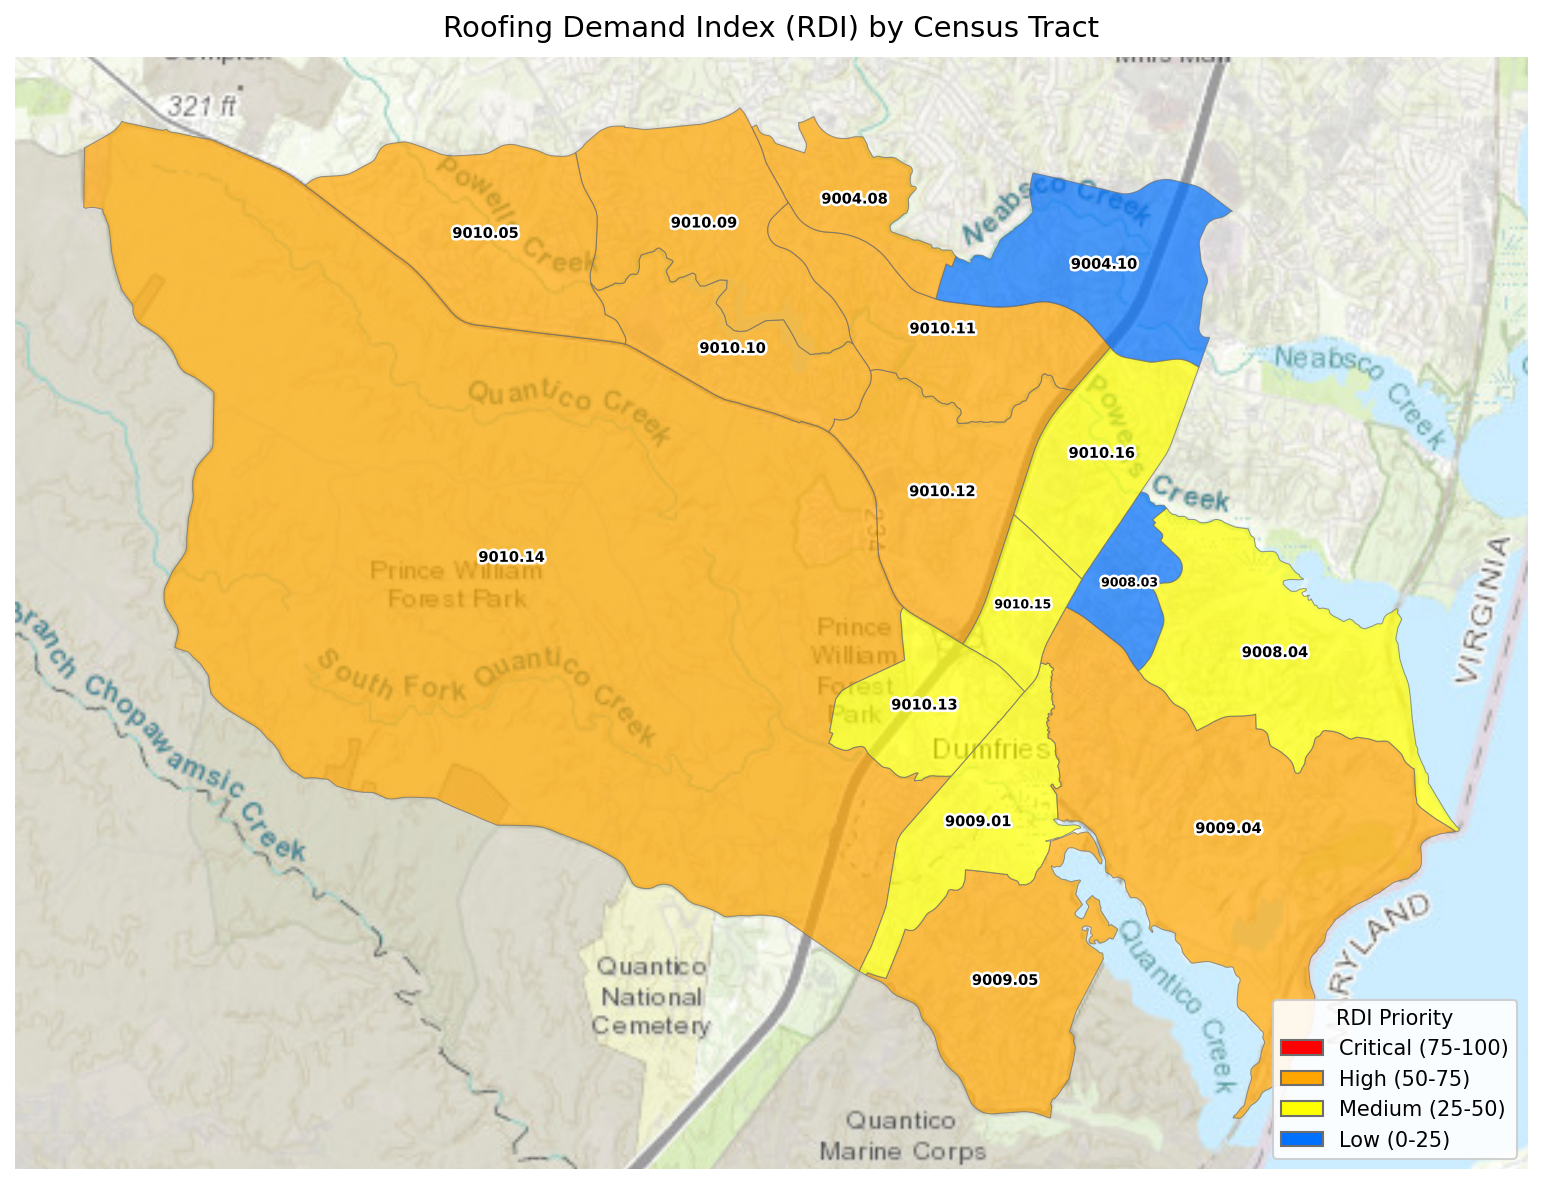
Our Roofing Demand Index analyzes 16+ data points per neighborhood — owner occupancy, housing age, storm history, income levels — so you knock on doors that actually convert.
Beat the Competition
See every roofing company within 15 miles mapped alongside your target areas. Know where the competition is saturated and where the opportunity is wide open.
Close More Jobs
Get estimated door counts, lead projections, and a week-by-week canvassing plan. Our reports typically identify $4,000-$17,000 worth of equivalent leads.
How It Works
Enter Your ZIP Codes
Tell us your service area.
We Analyze Everything
Census tracts, 10 years of storm data, housing age, competitors — all crunched in under 3 minutes.
Get Your Report
Interactive map, PDF report, and a ready-to-execute canvassing plan.
Built for Roofing Professionals

Target the right neighborhoods

See every competitor mapped

Strike after storms
See What You Get

Every report includes an interactive map, competitor analysis, storm intelligence, and a week-by-week canvassing plan — everything you need to close more jobs.
View Sample ReportWhat's Included
Detailed PDF Report
Executive summary, RDI scores, housing age analysis, lead projections, and a 5-week canvassing plan.
Interactive WebMap
Click any tract to see RDI scores, demographics, storm data, and competitor locations — all on one map.
Interactive Map
Full-screen interactive map with layer controls, tract details, and a shareable link.
$199/month — Everything You Need
- Up to 5 ZIP codes per report
- Unlimited report regenerations
- Interactive maps & dashboards
- Competitor analysis with Google Places data
- Storm alerts and peak season analysis
- 5-week canvassing plans with lead projections
- Cancel anytime